By: Jared Yost
The other day I was browsing around MTGPrice’s ProTrader Money board. A new addition to this tool is that it now offers buylist prices for all sets that there is data available. This piqued my interest and I decided that I would browse through some of the most recent sets to see who was offering the highest price for individual cards I was looking to buylist. Then I had an idea.
Having buylist data for thousands of cards offers us some insight into trends that appear for the vendors that MTGPrice tracks. By gathering the data and visualizing these trends we can better understand who offers the most for cards and how much we are leaving on the table when deciding to buylist.
I wanted to gather this information for Modern because it will be the most relevant format for all of us going into the summer. When the prices start rising up again and demand for Modern cards goes up, if you have a lot of a particular card and want to sell out buylisting is generally the quickest way to do this. However, as we’ll see sometimes creating eBay or TCGPlayer listings also have their rewards even if it may take longer to sell the item.
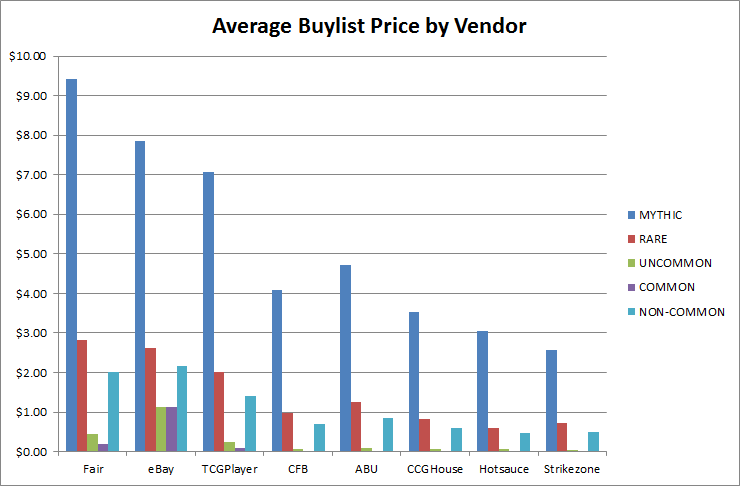
What I hope to accomplish by showing you these statistics is first and foremost the average buylist price by vendor. This will show us who on average will give you the most money for buylisting.
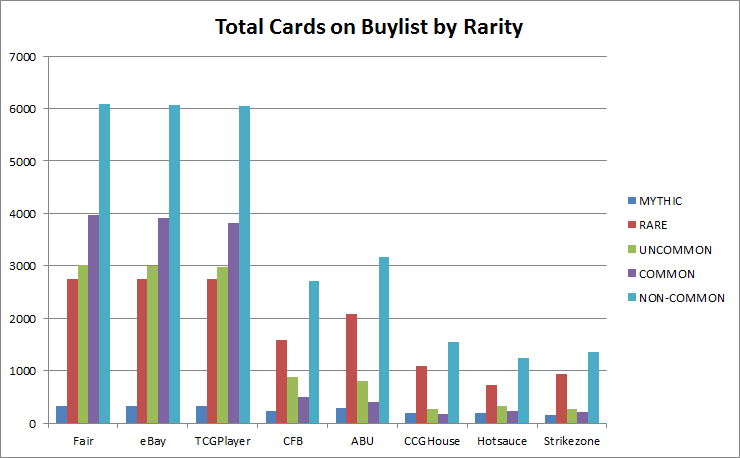
Secondly, we’ll want to see which vendor has the most cards listed on their buylist. If you’re going to ship a lot of cards you will want to know which buylist has higher odds of having more cards that you own and want to sell on it.
Thirdly, we’ll want to see the median and mode buylist prices for each vendor. This will give us a better understanding on who pays the most from a different perspective. The higher median price on average for uncommons and commons is important because it will tell us who has a higher range of prices for less valuable pieces of a collection. The mode for each vendor and rarity type will better tell us on average what you can expect to receive for any given rarity from a vendor.
Finally, the most important data point we’ll want to gather is the loss percentage (or money you are leaving on the table) for each buylist. This will indicate how much money you are losing compared to the MTGPrice fair retail value of card.
Data Collection Method
Before I show you the statistics let me tell you how I collected the data. The data set includes all non-foil cards from 8th Edition through Born of the Gods. 10,445 cards total are listed on the buylists. Not all of these will be used for the data analysis. Finally, we’re tracking all rarities from mythic to common.
- Buylists:
- Fair – This is the MTGPrice fair retail value of the card. This is what you can expect to buy the card for at a retail site or the value it is worth when trading.
- eBay – Though this is not a buylist vendor I wanted to include eBay because it is a good indicator of the market price for a card, more so than the fair price. This is one of the best ways to get a high cash value for your card.
- TCGPlayer – Same as eBay, not a buylist but allows you to get a higher cash value for a card if you’re willing to wait longer to sell it.
- CFB – Channel Fireball
- ABU – Alpha Beta Unlimited Games
- CCGHouse – CCGHouse.com
- Hotsauce – Hotsauce Games
- Strikezone – Strikezone.com
- All cards that were analyzed had a price of at least $0.01 on a buylist. The MTGPrice MoneyBoard buylist prices for some cards are $0 or blanks. I did not include these in the calculations. After taking these out of the calculations, here are the number of cards that were included to calculate the statistics for each buylist:
- Fair: 10,058
- eBay: 9,990
- TCGPlayer: 9,872
- CFB: 3,207
- ABU: 3,578
- CCGHouse: 1,739
- Hotsauce: 1,488
- Strikezone: 1,565
Calculations Explained
For the data itself, here is how I calculated each data point:
Average – Average price of a card on a vendor’s buylist. The average was calculated based on all the cards that you could purchase from the buylist. This is the average amount you would receive per card if you were to sell a lot of cards of varying rarities to the vendor.
Total Buying – The dataset of the buylist for the vendor. This is the total number of cards with a value greater than $0 (or not available to buylist) that was listed on the Money board for all cards on the buylist for that vendor.
Sum Total Prices – The sum of each individual card’s price on the buylist. This is useful to know to get an “index fund” view of the vendor to determine how valuable the vendor’s buylist is overall not taking into account averages. It is used in calculating your loss percentage for selling to that buylist.
Median – The mid value of the buylist. This is the price that is halfway between the buylist’s lowest and highest value.
Mode – The most common buylist value. This is the most likely value you will receive per card if selling to the buylist.
% Buying – Based on the total Fair prices available for cards greater than $0, this is the percentage of cards that you can sell to the vendor. In other words, based on the entire Modern cardpool this is the approximate amount of the cardpool you could buylist to the vendor at any given time.
Avg * Buy % – This is a more accurate representation of the average value per card you can get from the buylist. It is the average times the percentage of the Modern card pool that the vendor is buying. This price reflects an average based on availability for the vendor.
% Loss Total – The amount of money you are losing selling to the buylist. On average, if you sell a lot of cards to this buylist based on the fair trade value this is the approximate percentage per card you are losing buylisting those cards.
Real eBay – This is the real eBay value of all cards based on the eBay and PayPal transaction fee of approx 14% per sale.
Data Listed by Rarity
I analyzed the data according to rarity. I did this so it would be easy to see who offered the most not only on mythics and rares but also on commons and uncommons which is where you can make a surprising amount of money selling to a buylist.
I have a set of data for the following rarities:
ALL
MYTHIC
RARE
UNCOMMON
COMMON
NON-COMMON
I wanted to include ALL and NON-COMMON so that I could get a better picture of who in general offered better buylist prices.
ALL
| Vendor | Average | Total Buying | Sum Total Prices | Median | Mode | % Buying | Avg * Buy % | % Loss Total | Real eBay Total | Real eBay Loss | % Loss Total Update |
| Fair | $1.29 | 10058 | $12,960.17 | $0.22 | $0.14 | n/a | n/a | 0.00% | n/a | n/a | 0.00% |
| eBay | $1.76 | 9990 | $17,611.09 | $1.00 | $0.99 | 99.32% | 1.75 | 35.89% | $15,145.54 | 16.86% | 16.86% |
| TCGPlayer | $0.90 | 9872 | $8,923.88 | $0.10 | $0.06 | 98.15% | 0.88 | -31.14% | n/a | n/a | -31.14% |
| CFB | $1.33 | 3207 | $4,261.19 | $0.10 | $0.10 | 31.89% | 0.42 | -67.12% | n/a | n/a | -67.12% |
| ABU | $1.47 | 3578 | $5,251.03 | $0.21 | $0.02 | 35.57% | 0.52 | -59.48% | n/a | n/a | -59.48% |
| CCGHouse | $2.06 | 1739 | $3,583.09 | $0.51 | $0.10 | 17.29% | 0.36 | -72.35% | n/a | n/a | -72.35% |
| Hotsauce | $1.91 | 1488 | $2,845.03 | $0.45 | $0.05 | 14.79% | 0.28 | -78.05% | n/a | n/a | -78.05% |
| Strikezone | $1.92 | 1565 | $3,004.52 | $0.47 | $0.01 | 15.56% | 0.30 | -76.82% | n/a | n/a | -76.82% |
MYTHIC
| Vendor | Average | Total Buying | Sum Total Prices | Median | Mode | % Buying | Avg * Buy% | % Loss Total | Real eBay Total | Real eBay Loss | % Loss Total Update |
| Fair | $9.41 | 324 | $3,048.12 | $5.56 | $1.30 | n/a | n/a | 0.00% | n/a | n/a | 0.00% |
| eBay | $7.86 | 324 | $2,546.42 | $4.50 | $0.99 | 100.00% | 7.86 | -16.46% | $2,189.92 | -28.16% | -28.16% |
| TCGPlayer | $7.10 | 323 | $2,292.86 | $3.51 | $0.60 | 99.69% | 7.08 | -24.78% | n/a | n/a | -24.78% |
| CFB | $5.77 | 229 | $1,320.75 | $3.00 | $0.25 | 70.68% | 4.08 | -56.67% | n/a | n/a | -56.67% |
| ABU | $5.22 | 293 | $1,530.92 | $2.43 | $0.06 | 90.43% | 4.72 | -49.77% | n/a | n/a | -49.77% |
| CCGHouse | $6.05 | 189 | $1,143.37 | $3.01 | $3.01 | 58.33% | 3.53 | -62.49% | n/a | n/a | -62.49% |
| Hotsauce | $5.11 | 193 | $985.33 | $2.70 | $0.59 | 59.57% | 3.04 | -67.67% | n/a | n/a | -67.67% |
| Strikezone | $5.49 | 152 | $834.74 | $2.70 | $0.81 | 46.91% | 2.58 | -72.61% | n/a | n/a | -72.61% |
RARE
| Vendor | Average | Total Buying | Sum Total Prices | Median | Mode | % Buying | Avg * Buy% | % Loss Total | Real eBay Total | Real eBay Loss | % Loss Total Update |
| Fair | $2.83 | 2752 | $7,800.37 | $0.71 | $0.38 | n/a | n/a | 0.00% | n/a | n/a | 0.00% |
| eBay | $2.62 | 2746 | $7,206.26 | $1.00 | $0.99 | 99.78% | 2.61 | -7.62% | $6,197.38 | -20.55% | -20.55% |
| TCGPlayer | $2.02 | 2741 | $5,548.69 | $0.42 | $0.25 | 99.60% | 2.01 | -28.87% | n/a | n/a | -28.87% |
| CFB | $1.71 | 1585 | $2,711.00 | $0.25 | $0.10 | 57.59% | 0.98 | -65.25% | n/a | n/a | -65.25% |
| ABU | $1.64 | 2087 | $3,423.47 | $0.32 | $0.06 | 75.84% | 1.24 | -56.11% | n/a | n/a | -56.11% |
| CCGHouse | $2.05 | 1095 | $2,246.07 | $0.75 | $0.10 | 39.79% | 0.82 | -71.21% | n/a | n/a | -71.21% |
| Hotsauce | $2.25 | 733 | $1,647.65 | $0.68 | $0.23 | 26.64% | 0.60 | -78.88% | n/a | n/a | -78.88% |
| Strikezone | $2.12 | 935 | $1,986.63 | $0.65 | $0.14 | 33.98% | 0.72 | -74.53% | n/a | n/a | -74.53% |
UNCOMMON
| Vendor | Average | Total Buying | Sum Total Prices | Median | Mode* | % Buying | Avg * Buy% | % Loss Total | Real eBay Total | Real eBay Loss | % Loss Total Update |
| Fair | $0.44 | 3016 | $1,325.46 | $0.21 | $0.17 | n/a | n/a | 0.00% | n/a | n/a | 0.00% |
| eBay | $1.14 | 3002 | $3,428.58 | $0.99 | $0.99 | 99.54% | 1.13 | 158.67% | $2,948.58 | 122.46% | 122.46% |
| TCGPlayer | $0.24 | 2985 | $724.00 | $0.10 | $0.10 | 98.97% | 0.24 | -45.38% | n/a | n/a | -45.38% |
| CFB | $0.22 | 888 | $197.96 | $0.02 | $0.01 | 29.44% | 0.06 | -85.06% | n/a | n/a | -85.06% |
| ABU | $0.31 | 794 | $248.54 | $0.03 | $0.02 | 26.33% | 0.08 | -81.25% | n/a | n/a | -81.25% |
| CCGHouse | $0.65 | 265 | $171.08 | $0.15 | $0.05 | 8.79% | 0.06 | -87.09% | n/a | n/a | -87.09% |
| Hotsauce | $0.55 | 324 | $176.81 | $0.14 | $0.05 | 10.74% | 0.06 | -86.66% | n/a | n/a | -86.66% |
| Strikezone | $0.57 | 267 | $151.47 | $0.22 | $0.01* | 8.85% | 0.05 | -88.57% | n/a | n/a | -88.57% |
*Only 15 uncommons on Strikezone’s buylist are $0.01. The buylist is actually quite diverse for uncommons. 35 cards on the buylist are $1 or more for an uncommon and there are plenty of 50c uncommons.
COMMON
| Vendor | Average | Total Buying | Sum Total Prices | Median | Mode | % Buying | Avg * Buy% | % Loss Total | Real eBay Total | Real eBay Loss | % Loss Total Update |
| Fair | $0.20 | 3966 | $786.22 | $0.14 | $0.14 | n/a | n/a | 0.00% | n/a | n/a | 0.00% |
| eBay | $1.13 | 3918 | $4,429.83 | $1.00 | $0.99 | 98.79% | 1.12 | 463.43% | $3,809.65 | 384.55% | 384.55% |
| TCGPlayer | $0.09 | 3823 | $358.00 | $0.06 | $0.06 | 96.39% | 0.09 | -54.47% | n/a | n/a | -54.47% |
| CFB | $0.06 | 505 | $31.48 | $0.01 | $0.01 | 12.73% | 0.01 | -96.00% | n/a | n/a | -96.00% |
| ABU | $0.12 | 404 | $48.10 | $0.02 | $0.02 | 10.19% | 0.01 | -93.88% | n/a | n/a | -93.88% |
| CCGHouse | $0.11 | 183 | $19.51 | $0.03 | $0.01 | 4.61% | 0.01 | -97.52% | n/a | n/a | -97.52% |
| Hotsauce | $0.15 | 238 | $35.24 | $0.05 | $0.05 | 6.00% | 0.01 | -95.52% | n/a | n/a | -95.52% |
| Strikezone | $0.15 | 211 | $31.68 | $0.09 | $0.01 | 5.32% | 0.01 | -95.97% | n/a | n/a | -95.97% |
NON-COMMON
| Vendor | Average | Total Buying | Sum Total Prices | Median | Mode | % Buying | Avg * Buy% | % Loss Total | Real eBay Total | Real eBay Loss | % Loss Total Update |
| Fair | $2.00 | 6092 | $12,173.95 | $0.39 | $0.17 | n/a | n/a | 0.00% | n/a | n/a | 0.00% |
| eBay | $2.17 | 6072 | $13,181.26 | $1.00 | $0.99 | 99.67% | 2.16 | 8.27% | $11,335.88 | -6.88% | -6.88% |
| TCGPlayer | $1.42 | 6049 | $8,565.88 | $0.23 | $0.10 | 99.29% | 1.41 | -29.64% | n/a | n/a | -29.64% |
| CFB | $1.57 | 2702 | $4,229.71 | $0.10 | $0.10 | 44.35% | 0.70 | -65.26% | n/a | n/a | -65.26% |
| ABU | $1.64 | 3174 | $5,202.93 | $0.25 | $0.06 | 52.10% | 0.85 | -57.26% | n/a | n/a | -57.26% |
| CCGHouse | $2.29 | 1556 | $3,563.58 | $0.75 | $0.10 | 25.54% | 0.58 | -70.73% | n/a | n/a | -70.73% |
| Hotsauce | $2.25 | 1250 | $2,809.79 | $0.59 | $0.23 | 20.52% | 0.46 | -76.92% | n/a | n/a | -76.92% |
| Strikezone | $2.20 | 1354 | $2,972.84 | $0.62 | $0.14 | 22.23% | 0.49 | -75.58% | n/a | n/a | -75.58% |
So, What Does This Tell Us?
This graph was created using the “Avg * Buylist %” column for each rarity type by vendor. This is a better representation of the average amount you will receive per card when selling to a buylist because it factors in how many cards are available on that vendor’s buylist.
The key to this graph is to look at the NON-COMMON data. Fair is hovering around $2, right? So why is it that on eBay you can get a higher value on average for your cards than the fair price? That seems strange considering you are supposed to be selling at lower than Fair since it is eBay right? Well, the retail sites aren’t buying all the random uncommons in your collection which could be the case on eBay. This is why you see higher averages for eBay than Fair, but good luck trying to sell everything through eBay alone. ABU appears to have highest buylist prices on average for non-common cards.
Looking at the bottom of the chart, the uncommons and commons don’t seem to even appear on the charts. It looks like eBay is the way to go if you need to get rid of commons and uncommons – look at how much higher on average you can get for a common/uncommon on eBay versus the other ways of selling! Of course, this could be a large margin of error on the price scraping tool’s part where it collects eBay auctions that are selling more than one copy of a common/uncommon. Still though if you have the drive and determination you could probably sell a lot of commons and uncommons on eBay even if the auctions are for playsets. You will get a lot higher than the $0.01 buylist prices of the retail sites.
Average doesn’t tell us the whole story, however. We should also look at it from another perspective.
It may be true that the shops are buying fewer commons and uncommons, and who can blame them since they are generally worth less than mythics and rares. Note that they still do buy these types of cards, and for some shops like CFB and ABU they are not an insignificant number. Just be aware that at some point the law of diminishing returns will come into play – how much effort do you want to make on buylisting a bunch of $0.01 cards?
CFB and ABU are buying significantly more cards than their competitors by looking at the total non-common cards that are on their buylists. This helps curb the law of diminishing returns. If you have a lot of cards to offload, it can be convenient to ship them all to one buylist and get paid all from one source. You will have a better chance of doing this through CFB or ABU for Modern cards. Not to say that you won’t get the best price, especially on a card by card basis. But on average you will be able to sell more to these shops and thus increase your chances of offloading cards that you may otherwise have to put more work into selling.
Let’s look at the data from more perspectives, the median and mode buylist prices per vendor.
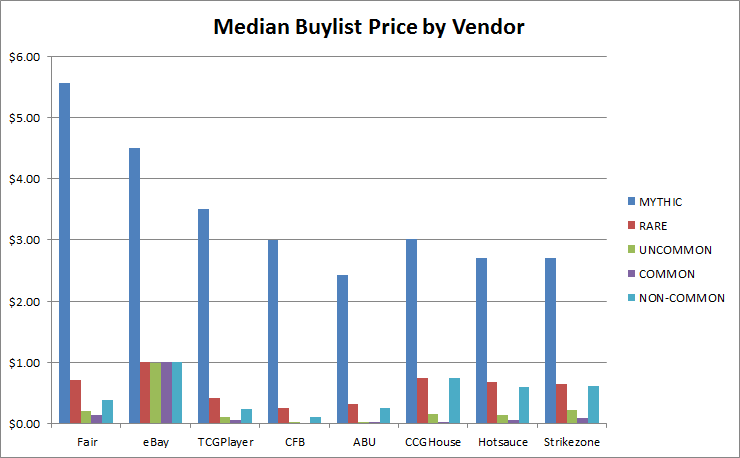
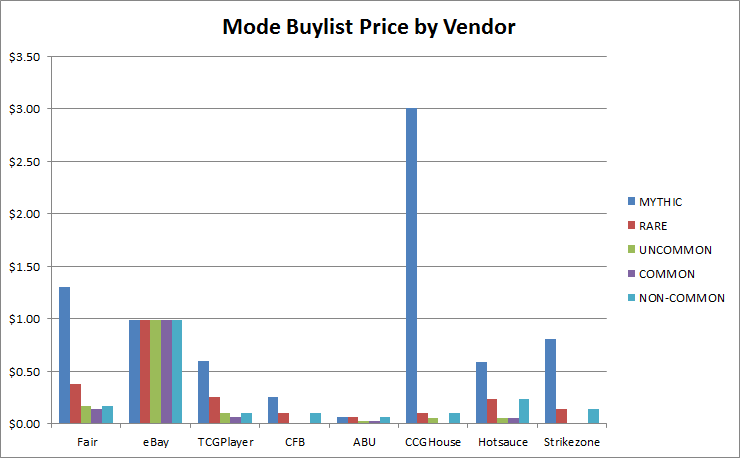
By knowing the median price per vendor we can compare it to the average and see how far off the two are. If they are off by a large margin, that means that a few data points are skewing the average upwards or lower. Thankfully the average and median graphs are very similar looking which means that there aren’t any outliers on any of the buylists that are significantly altering the average.
The mode, on the other hand, tells us what the most common price per buylist we can expect for a rarity. The clear outlier here is CCGHouse – if you are in the market for buylisting mythic rares, CCGHouse is buying most of their mythics at $3. What CFB and ABU offer for the guy that wants to get rid of a large amount of commons and uncommons they clearly lack for mythics – most mythics on ABU’s buylist are less than $0.10. If you have a lot of mythics you should definitely check out CCGHouse because odds are they will pay the most for your mythic rare. Hotsauce and Strikezone pay more for mythics than CFB and ABU but they have significantly fewer cards on their buylist than the other stores. It looks like Hotsauce pays more per rare on average than other retail sites so if you have a lot of rares you may want to look at Hotsauce as your vendor of choice.
Seeing the eBay numbers for these graphs does make me suspicious. For commons and uncommons, I’ll guessing that MTGPrice counts a playset auction as one card sold which does skew this data in a big way. If the data was collected more reliably from eBay I would predict that it would have statistics similar to TCGPlayer.
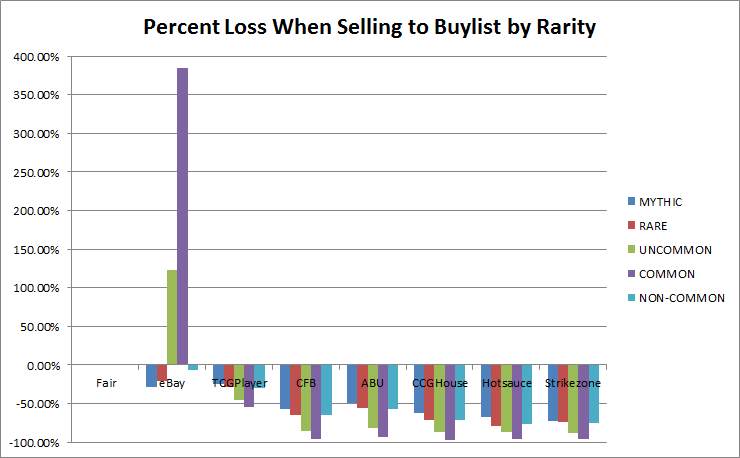
Finally, I’ll show you the loss percentage per vendor when buylisting.
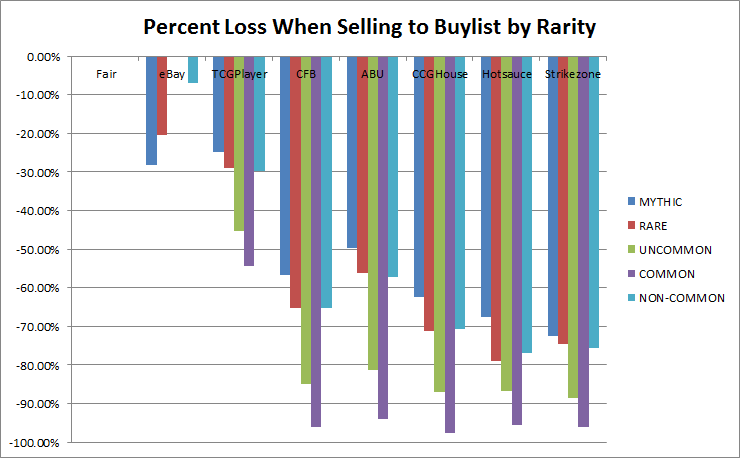
Disregarding the strange eBay results I was getting, here is the chart starting at 0%.
The reason that eBay was so high on the other chart is because I was getting absurdly high averages for common and uncommon cards that were “sold” on eBay. The most likely reason for this is because they are sold in playsets which means that if you have four of them you can probably sell them for a dollar through eBay. This is pretty decent considering how much lower buylists are. It is a lot of work to be successful at it though.
Looking at loss percentage for the retail websites, the clear winners are ABU, CFB, and CCGHouse. Your losses for non-commons that you sell to those buylists on average are going to be smaller than selling to Hotsauce or Strikezone. Generally speaking, the best way to go is eBay or TCGPlayer if you have the determination and time to get the most money but selling to stores is good if you are pressed for time.
One interesting thing to note is that selling through TCGPlayer does seem to have a much larger loss than I was expecting. For non-common cards in general, you are losing on average about 30% selling through TCGPlayer. This seems pretty high to me. One reason I can think it is so high is because MTGPrice may track all condition types – so MP, HP, and SP cards could be included in that loss. Even still, I didn’t factor in the additional loss you will encounter when listing the items – TCGPlayer charges an 8.5% TCGplayer fee + a PayPal / credit card processing fee (which I think is around 3%). So that loss percent would be even higher if I included that in the calculations. It appears that TCGPlayer is having a “race to the bottom” effect on prices where people are continuing to outbid everyone else on low prices. I wonder if this loss percentage for TCGPlayer will only increase going into the future?
Final Thoughts
So, I realize that this was A TON of information so I’ll try to keep this section short and sweet.
I learned a lot from this endeavor. I learned exactly how much I will be losing when selling to a buylist, but I also learned which buylists and websites I can expect to get a better price for mythics, rares, uncommons, and commons. I thought that analyzing the buylist data for all the Modern legal cards across several several vendors, eBay, and TCGPlayer would be useful for the community to make judgements about how they want to sell their cards. I hope you all can take something away from this like I did.
I would have loved to include data from more vendors (let’s face it, Starcity is out of the question however Cardkingdom is usually pretty competitive) to get a better market picture. I think that I’ve hit a lot of the big names though so the market data should be pretty relevant. Happy selling during Modern season! Also, a shout out to MTGPrice for scraping this data in their new buylist Money Board feature.
Why never talk about http://www.magiccardmarket.eu ? It’s the best, the fair, and the cheapest site to buy Magic Cards, and never gets quoted….
Unfortunately, the buylist tracker does not include magiccardmarket.eu prices! If it had data, I would be more than happy to include them to see if there are any advantages to selling through that website.
We definitely plan on tracking EU stores (especially magiccardmarket) but we have a few other things that need to be done first. We have around three US vendors that need to be added and then we need to decide on the best way to handle non-us currencies.
It’s really odd to me that you omitted Card Kingdom. I understand why- it was inconvenient for the purposes of your data collections methods. I, like a good portion of your readers, buylist using Trader Tools rather than accessing individual sites. Over time and with feedback with from the QS Community we have pared Trader Tools down to 3 sites – Adventures On, Card Kingdom and ABU. I would say 50% of the cards I buylist go to Card Kingdom and Adventures On and ABU split the other 50% almost down the middle. Card Kingdom pays so well that high-profile financiers like Ryan Bushard eschew Trader Tools even, preferring to buylist to Card Kingdom only.
I like the article and the analysis but I don’t know if we can agree with all of you conclusions unless we cast a wider net, at least with respect to which dealers buy the most cards and pay the most. There is a bit more to the value equation vis-a-vis whether to eBay/TCGPlayer vs. buylisting, but there is a good 2-4 articles’ worth of material there.
Great job. I’m proliferating this piece a little bit because I like the kind of thought it provokes. Look into Card Kingdom while we’re at it -that’s the kind of data a project of this scope wants to include.
^^I agree. As I scrolled through the data, CK was the next vendor name I scanned for after spotting TCGplayer.
Also, have you tried scaling the mythic buylist prices to control for buylsit size? If you plugged in a 0 for every mythic CCG House isn’t buying, do they stop being such a huge outlier? The graph seems to imply CCG House would pay $3 for a Mythic Strikezone will pay $0.10 for when in reality, CCG House won’t buy a Mythic StrikeZone will pay $0.10 or $0.25 skewing their buylist very high. There has to be a way to control for that, otherwise a vendor that pays $80 for Tarmogoyf and doesn’t buy any other card will have an average buy price of $80
Yes, I did account for $0 or no buylist price for all the calculations. You are correct though, mode can be deceiving if looked at by itself. From the dataset, CCGHouse is buying 22 mythics for $3. However, in total it is buying 189 mythics – so the probability you are going to sell a mythic for $3 is 11.6%. Not that high but for $3 it might be worth it to check the buylist just in case.
CFB and ABU are buying 229 and 293 mythics respectively. CFB has 34 mythics at $0.25 and ABU has 11 mythics at $0.06, which are there mode values. That’s 14.8% and 3.8% respectively. Looks like the mode for ABU is deceiving here since there are so many more cards on their buylist. Their buylist for mythics must be very diverse similar to Strikezone’s uncommon buylist numbers.
Mode is just another way of looking at the data. Not the most accurate (I would consider the average based on total buying is the best view of the data) but it does give us a different perspective that leads to further discussion.
Thanks a lot for your responses.
Good luck with the current work, i hope you can reach Europe very soon.
I’ll be following your site closely, bud. Thanks for what you do. Somedays the buy/sell/hold strategy feels like Bitcoin speculation. You’ve done the market research and spelled it out as straightforward as possible. Here’s to making money. cheers!